Reliability of VOC emission chamber testing – A round-robin test with a parquet adhesive, a parquet lacquer, and a levelling compound
The Association for the Control of Emissions in Products for Flooring Installation, Adhesives and Building Materials (GEV) organised a round-robin test in 2023 with the purpose to update its list of recommended testing laboratories based on test results. 39 laboratories from 11 countries tested the VOC emissions of 3 test products, a parquet adhesive, a parquet lacquer, and a levelling compound. The GEV round-robin test 2023 showed a similar variation of the test results as had been observed in previous round-robin tests in 2017 and 2020. The variation of the test results confirms the limited significance of single test results. This is why GEV discloses VOC emissions only in terms of broad emissions classes. The performance of 22 laboratories was rated by GEV to be good. Currently, a list of recommended testing laboratories for GEV emissions testing comprises 18 laboratories from 6 countries. These laboratories met the performance requirements of GEV in the round-robin test and presented an accreditation of this testing protocol according to ISO/IEC 17025.
1 Introduction
The Association for the Control of Emissions in Products for Flooring Installation (Gemeinschaft Emissionskontrollierte Verlegewerkstoffe, Klebstoffe und Bauprodukte e.V. (GEV)) was established in 1997. GEV developed the label EMICODE®. It allows manufacturers to show low product emissions of volatile organic compounds (VOCs) into indoor air. The VOC emissions are expressed in different emissions classes. This voluntary label demonstrates low VOC emissions of construction products. The EMICODE® is accepted as proof of low emissions by many certifiers of sustainable buildings, such as LEED, BREEAM and DGNB.
The complexity of the testing procedure is a challenge for the participating laboratories. This was shown by earlier round robin tests [1 to 4]. It is an essential goal of GEV to regularly repeat the round robin test. The intention is to support the members of GEV with a list of reliable laboratories, and to give neutral feedback to the laboratories about possible improvements. 44 testing laboratories from 15 countries followed the call for voluntary participation in the 2023 round robin test. 39 of these laboratories reported test results:
- 20 laboratories from Germany,
- 5 laboratories from Italy,
- 4 laboratories from China,
- 2 laboratories each from Belgium and Finland,
- 1 laboratory each from Austria, Denmark, France, Spain, Switzerland, and the USA.
Among the 39 participating were
- 24 commercial testing laboratories,
- 7 public laboratories or research organisations,
- 8 industry internal laboratories.
2 Methodology
2.1 Organisation and preparation
Three products were used for this performance comparison: a parquet adhesive, a parquet lacquer, and a levelling compound. The GEV testing method specifies measurement of VOC emissions after 28 days storage in a ventilated test chamber. For this round robin test, samples were selected which allowed the determination of significant emissions already after 3 days. This was essential for a robust statistical evaluation of the results. Pre-tests had confirmed the applicability of this procedure. The homogeneity of the testing material and its stability during the testing period were monitored. Three GEV member companies prepared the test samples, two companies distributed them to the participants.
The tests were performed in March and April 2023.
2.2 Test procedure
The participants had to test three products according to the GEV testing method [5] with the following additional specifications:
- No pre-conditioning of the parquet adhesive and of the levelling compound.
- 3 days pre-conditioning of the parquet lacquer in a separate ventilated test chamber (GEV testing method specifies pre-conditioning as an option).
- Measurement of the emissions of VOC, SVOC (semi-volatile organic compounds), formaldehyde and acetaldehyde already after 3 days storage in a ventilated test chamber.
The GEV testing method [5] specifies details of test specimen preparation, test chamber conditions, air sampling and air sample analyses. Other procedural steps are based on EN 16516 [6].
2.2.1 Test specimen and test chamber
The participants had to test three products according to the GEV testing method [5]:
- Mixing of the test sample to obtain a homogenous product.
- Sample preparation for the parquet adhesive: 300 ± 10 g/m² on a glass plate, surface structured with a B1 notched trowel.
- Sample preparation for the parquet lacquer: 150 ± 2 g/m² on a glass plate, with even surface.
- Sample preparation for the levelling compound: Mixing with water as specified by the supplier. Application on a glass plate with 3 mm layer thickness.
- Loading of the test chamber: 0.4 m²/m³.
- Storage of the test specimen in the test chamber at (23 ± 1)°C, (50 ± 5)% relative humidity of the supplied air, (0.5 ± 0.025)/h air exchange rate.
2.2.2 Air sampling, analyses, reporting of results
VOCs and SVOCs were sampled from test chamber air with adsorption tubes that contained the polymer Tenax TA®. The tubes were analysed by gas chromatography (GC) with a mass selective detector (MSD) after thermal desorption (TD).
Formaldehyde and acetaldehyde were sampled with cartridges or adsorption tubes that contained silica gel, impregnated with 2.4-dinitrophenylhydrazin (DNPH). The tubes or cartridges were analysed by high performance liquid chromatography (HPLC) with a UV or a diode array detector after extraction with acetonitrile.
Most laboratories performed the test chamber air measurements as double or multiple determinations for internal QA/QC purposes. But only one test result had to be reported – the decision was left to the laboratories. The participants submitted their test results online via an input mask.
2.3 Statistical evaluation
QuoData GmbH performed the statistical evaluation of the reported test results according to ISO 13528 [7]. That standard generally assumes a normal distribution of the data. This could be confirmed for some data, such as the TVOC values, but not for all results, e.g., not for the R value. The robust Q/Hampel method as specified in ISO 13528 was applied. This method only requires a unimodal distribution. QuoData GmbH had applied a kernel density estimation according to ISO 13528 to all data of the 2017 GEV round robin test using a proprietary software solution. No critical anomalies were observed, i.e., none of the evaluated data series showed a bimodal or even multimodal distribution. This demonstrated that the Q/Hampel method can be applied to data of a VOC emissions round robin test.
2.3.1 Assigned value (target value)
No objective true value is available for the tested samples. Therefore, a consensus value is calculated from the reported test results as robust, weighted arithmetic mean value. This is called „assigned value“ in ISO 13528 [7]. It is taken as a substitute for the true value. This is the target value that should be reached by the participating laboratories.
Following the robust Q/Hampel method, individual results are included with less weight in the statistical evaluation if they deviate from the mean value by more than 1.5 times the standard deviation – the larger the deviation, the less weight is given. For more details, see ISO 13528, Annex C.5.3 (Hampel estimator) [7]. As an example, test results deviating from the mean value by more than 4.5 times the standard deviation do not have any influence on the evaluation. If a laboratory did not report a specific parameter, then it could not be determined whether that laboratory saw an insufficient amount of that substance to report it, or whether the laboratory did not detect the substance at all. Therefore, no value was included in the evaluation in those cases. Consequently, the assigned value is not significantly influenced by missing or strongly deviating results. It can be used as a convenient target value.
2.3.2 Standard deviation for proficiency assessment
No generic method specific standard deviation is known for this testing method. Therefore, the „standard deviation for proficiency assessment“ was calculated from the reported test results as robust reproducibility standard deviation according to the Q method (ISO 13528, Annex C.5.2. [7]).
If the homogeneity test had shown a non-homogeneous distribution of the emissions across a total testing sample, then the standard deviation for proficiency assessment would have been expanded by the standard deviation caused by the inhomogeneity. This was not necessary in this case.
2.3.3 Standard and expanded uncertainty of the assigned value
The robust standard deviation is multiplied by 1.25 and divided by the square root of the number of the participants in the round-robin test (see ISO 13528) to give the „standard uncertainty of the assigned value“. This is generally assumed to be the best estimator for round-robin tests. The „expanded uncertainty“ (95 percentile) of the assigned value is given by multiplication by 2. Test results within this uncertainty of the assigned value are regarded to be close to the target value.
2.3.4 z-score
This evaluation assumes that the reported test results follow a normal distribution, or at least a unimodal distribution. If the test results follow a normal distribution, then it can be expected that
- 68 % of the test results are within 1 standard deviation of the target value,
- 95 % of the test results are within 2 standard deviations of the target value,
- 99.7 % of the test results are within 3 standard deviations of the target value.
The z score is the difference of a single test result from the target value, divided by the standard deviation for proficiency assessment. This value can be larger or smaller than 0: A z score larger than 0 means, the test result is above the target value. And a z score smaller than 0 means, the test result is below the target value. The results were classified as specified in ISO 17043 [8] with one additional performance level:
- z score of +1 to –1 The deviation of a test result from the target value is smaller than 1 standard deviation, meaning within the 68 % confidence interval. This is regarded as a good satisfactory result.
- z score of +1 to +2, or –1 to –2 The deviation of a test result from the target value is larger than 1 standard deviation, but smaller than 2 standard deviations. This is generally regarded as a satisfactory result.
- z score of +2 to +3, or –2 to –3 The deviation of a test result from the target value is larger than 2 standard deviations, but smaller than 3 standard deviations. This is generally regarded as a questionable result.
- z score of +3 or larger, or –3 or smaller The deviation of a test result from the target value is larger than 3 standard deviations. This is generally regarded as an unsatisfactory result.
All z scores refer to a single test parameter and a single sample in one testing laboratory. This tool is not designed to assign any type of score to a testing laboratory as a total.
2.3.5 Limitations of the statistical evaluation
This purely statistical evaluation is based on the test results reported by the participating laboratories. However, it may occur that the reported data do not allow a meaningful evaluation, even if the statistical procedures formally could be applied. No objective true target value is available. It cannot be excluded that a larger group of laboratories delivers wrong results either systematically or at random. As an example, some laboratories may fail with correct identification of the emitted VOCs. Other laboratories can experience difficulties to correctly quantify glycols and glycol ethers, see [3]. Therefore, a statistical evaluation should always be followed by a technical assessment and a plausibility check. This includes knowledge of which substances are expected to be emitted during the chamber tests, as well as analytical challenges as discussed in an earlier study [3], and below.
3 Results
Not all laboratories reported all requested parameters. Non-reported values were not replaced by substitute values, but ignored in the evaluation.
3.1 Homogeneity and stability of the emissions
Eurofins Product Testing A/S performed homogeneity tests for selected VOCs on behalf of GEV. No homogeneity tests were conducted for sum parameters such as TVOC and R value. Three randomly chosen test items were analysed in single determination at the beginning of the round robin testing period (mid of March 2023) and three other items at its end (end of April 2023). The test data were evaluated statistically by QuoData GmbH. As the heterogeneity standard deviation was not larger than 0.3 times the standard deviation for proficiency assessment, the test material was considered sufficiently homogeneous (see Annex B.2.2 in ISO 13528 [7]).
QuoData GmbH performed a statistical assessment of the stability of the testing material over time with a t test, considering the variance of the results of the homogeneity testing. The three early test items were compared with the three late ones. For most tested VOCs, no statistically significant trend nor any instability was recorded for most investigated test parameters. Accordingly, the assessment of the laboratory test results by means of z scores was carried out without any restriction.
This was different for the emission of ethylene glycol from the levelling compound. While the first tests resulted in significant emissions, the tests 6 weeks later did not show any ethylene glycol at all. Stability could not be confirmed, and there were not sufficient test data for a homogeneity assessment. But an analysis of the results reported by the participating laboratories showed that stability of ethylene glycol could be confirmed (Figure 1). The participants in the round robin test started testing within a period of only 16 days. This may be the reason why no decrease of the emission of ethylene glycol was observed within that shorter time. Ethylene glycol then was considered suitable to statistical analysis within this round robin test.

Figure 1. Results for ethylene glycol against start time of emissions test for the tested levelling compound. Graphic: QuoData GmbH
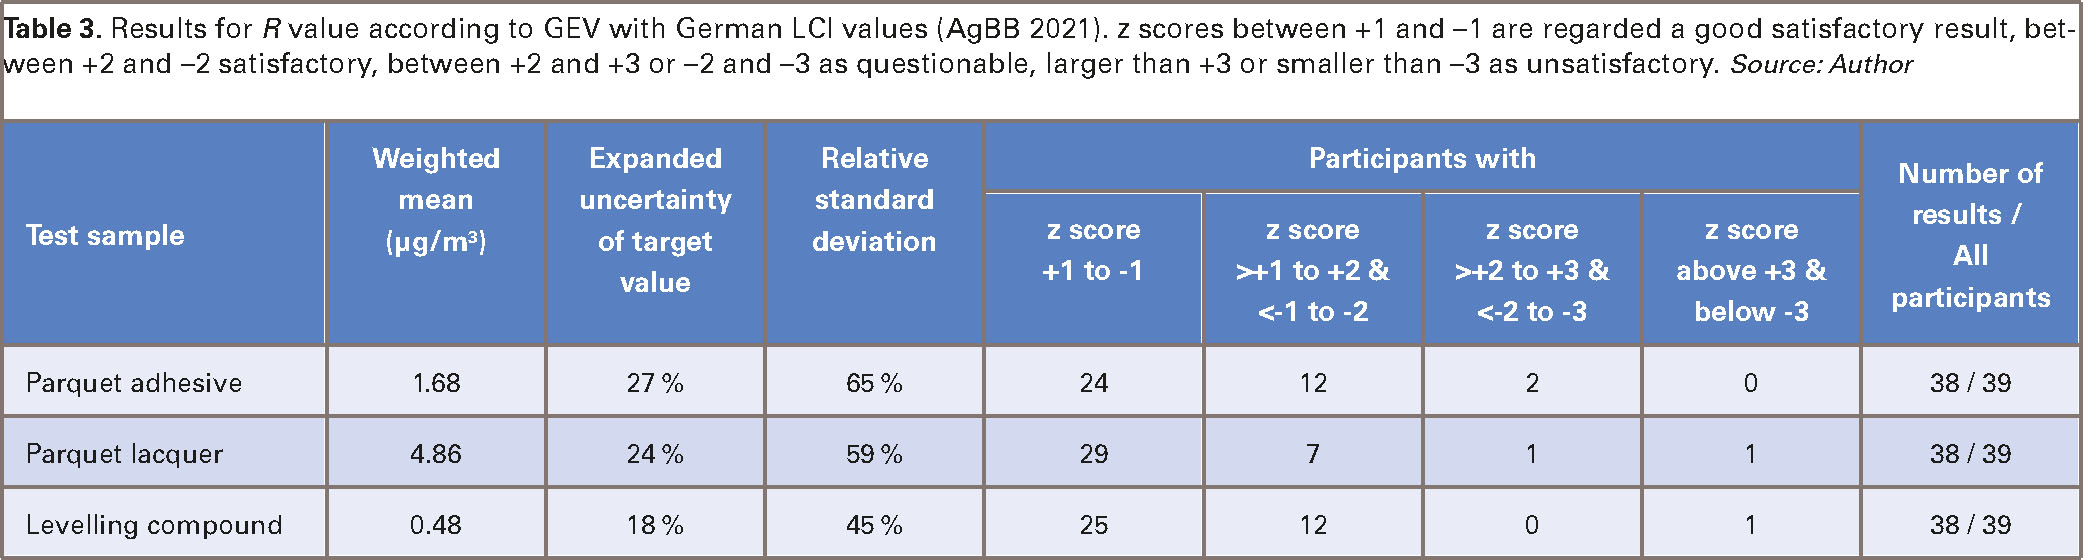
The test samples were taken from technical products. These are not optimized for homogenous VOC emissions across a production batch. The test samples shall be homogenised before preparing the test specimen. The applied techniques show different mixing efficiency. This can influence the variation of test results between different laboratories. The results are summarized in Table 3.
3.2 TSVOC and TVOC results
The TSVOC value (Total Semi-Volatile Organic Compounds) was not evaluated statistically for any tested items. The test results of most laboratories were below the required determination limit of 5 µg/m³.
The TVOC value (Total Volatile Organic Compounds) was calculated in two different ways. In both cases, the contribution of acetic acid to TVOC was excluded from the calculation as specified by the GEV testing method.
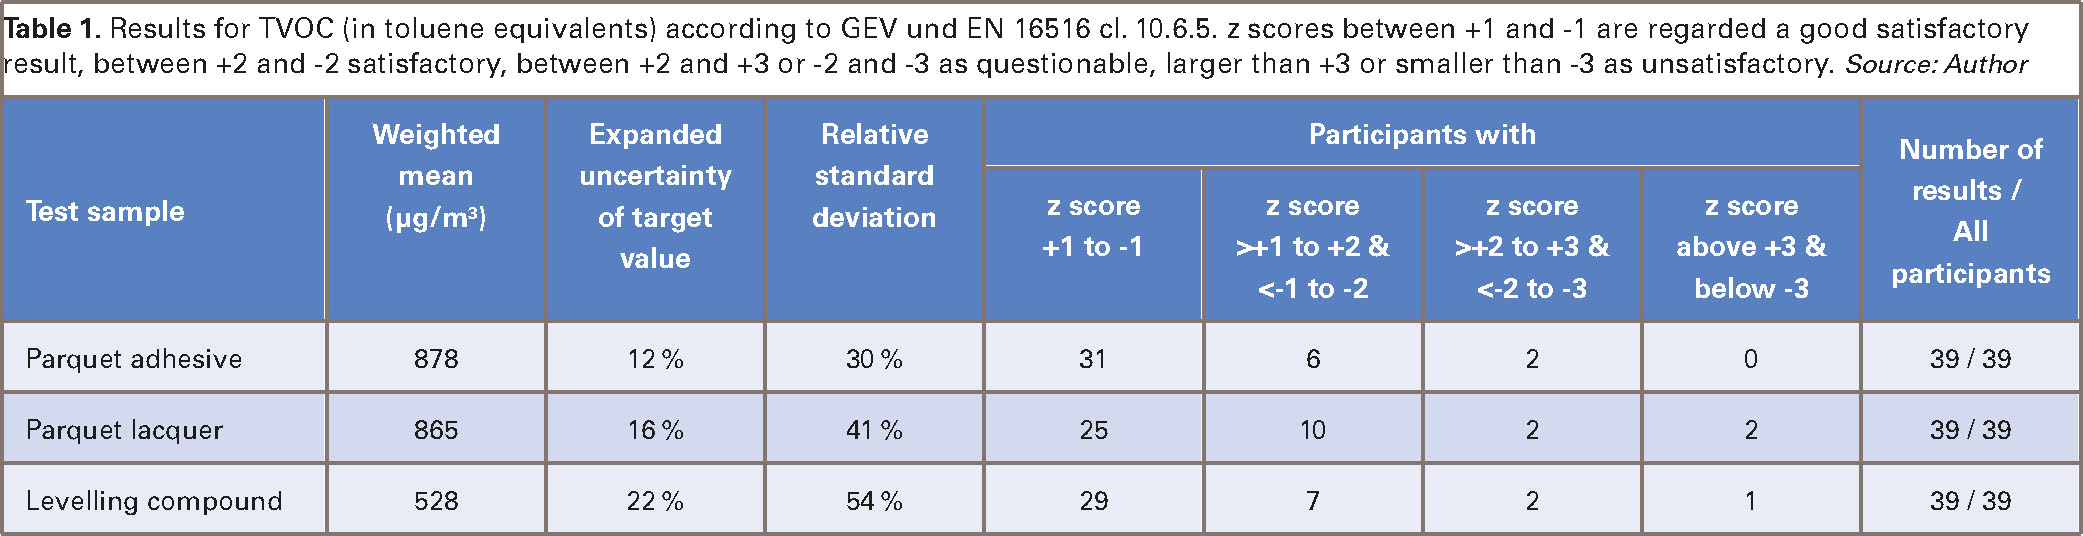
The TVOC value according to the GEV testing method [5] and EN 16516 (Clauses 8.2.6.2 and 10.6.5) [6] was determined in toluene equivalents. This means that all single VOC substances were calculated with the response factor of toluene and summed, if above the reporting limit of 5 µg/m³.
And (different from EN16516) all values were summed for which the results in toluene equivalents were above the reporting limit of 5µg/m³.
The results are summarized in Table 1 and Figure 2.
 for the tested parquet adhesive. Graphic: QuoData GmbH")
Figure 2. Distribution of results for TVOC (in toluene equivalents) for the tested parquet adhesive. Graphic: QuoData GmbH
The „Sum of the VOCs“ according to EN 16516, Clause 10.6.8 [6], also called TVOCSPEZ value by AgBB, was determined such that
- all single VOC substances with a German LCI limit value (AgBB 2021) [9] were calculated with their respective substance specific response factor, (LCI = lowest concentration of interest),
- all single VOC substances without a German LCI value and all non-identified VOCs were calculated with the response factor of toluene,
- and (different from EN 16516) all values were summed for which the results in toluene equivalents were above the reporting limit of 5 µg/m³.
The results are summarized in Table 2 and Figure 3.
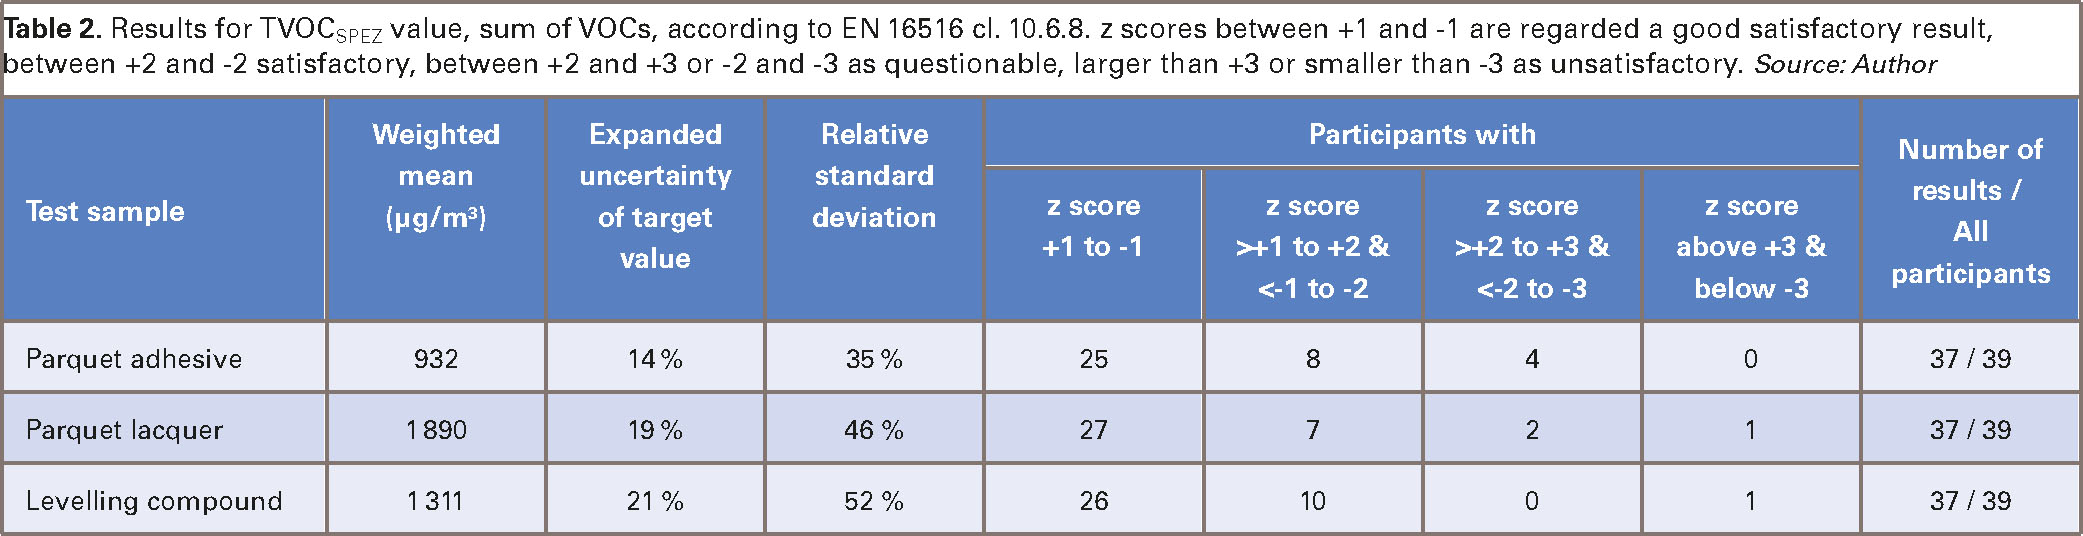

Figure 3. Distribution of results for TVOCSPEZ, sum of VOCs, for the tested parquet adhesive. Graphic: QuoData GmbH
3.3 Results for the R value
Individual VOC substances had to be quantified if the respective test result in toluene equivalents was at least 5 µg/m³ (reporting limit). Substances with a German LCI limit value (AgBB 2021) [9] had to be calibrated and quantified with their respective substance specific response factors. Then the R value was calculated as sum of all quotients of each individual test result and its respective German LCI value.
3.4 Results for single substances
The participants had not been informed about the substances to be analysed. Each participant had to identify and quantify the individual VOCs that were emitted under the specified testing conditions. Individual VOC substances had to be quantified if the respective test result in toluene equivalents was at least 5 µg/m³ (reporting limit as specified in GEV testing method [5]).
The reported results were evaluated statistically only for those VOCs that had been found by many participants in relevant amounts. The results for formaldehyde and acetaldehyde were not statistically evaluated because almost all testing laboratories delivered either no results for these substances, or results below the reporting limit of 5 µg/m³.
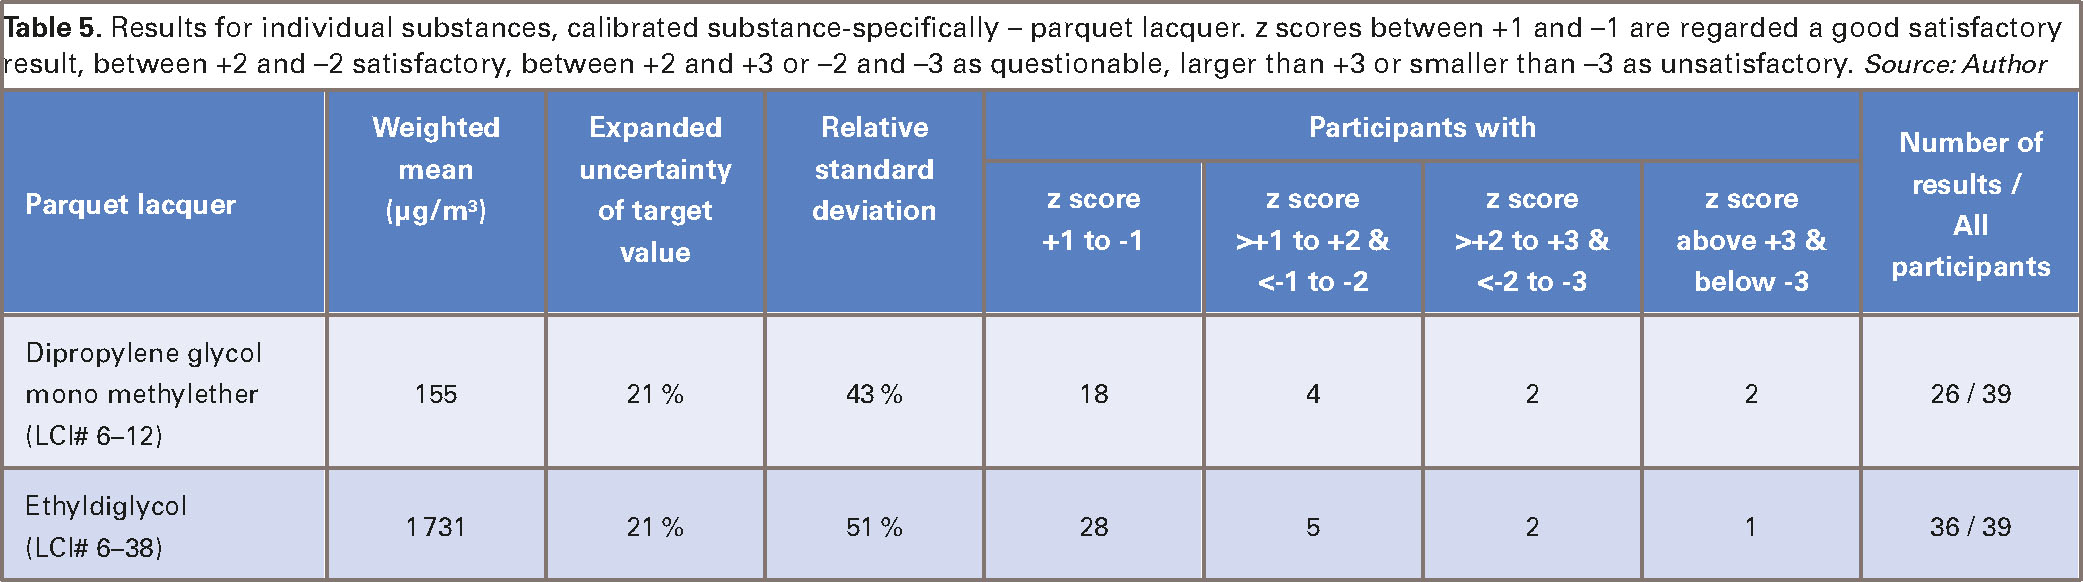
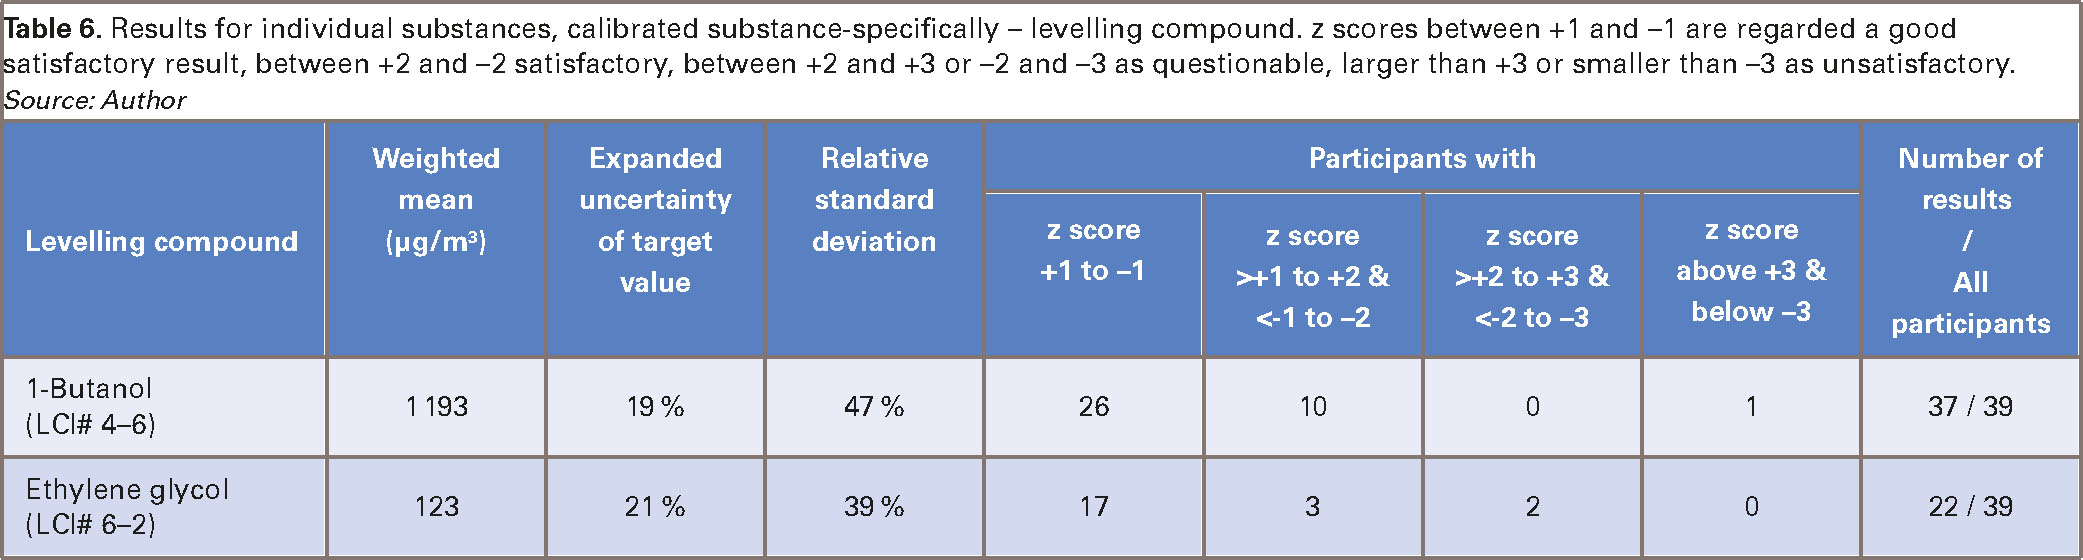
The results for the dominating individual substances are summarized in Tables 4, 5 and 6.
z scores between +1 and -1 are regarded a good satisfactory result, between +2 and -2 satisfactory, between +2 and +3 or -2 and -3 as questionable, larger than +3 or smaller than -3 as unsatisfactory.
4 Assessment and discussion of the results
4.1 Acetic acid
It is a challenge to determine acetic acid with the applied methodology. The adsorption tubes filled with Tenax TA have a low adsorption capacity for acetic acid and are quickly saturated. That is the reason why EN 16516 [6] states in a note to clause 8.2.1:
„A few VOCs like acetic acid are not quantitatively analysed under the conditions specified in this method. In this case, an alternative sorbent or series of sorbents or alternative conditions can be used to confirm a test result.“
Alternative testing methodologies for acetic acid are specified in VDI 4301 Part 7 [10].
The present round robin test included only test results obtained by adsorption on Tenax TA. GEV testing method specifies that the contribution of acetic acid to TVOC and R value had to be excluded from those calculations. This did not make a significant difference in this round robin test because acetic acid was not found in significant amounts.
4.2 TVOC, TVOCSPEZ and TSVOC
The results did not show any improvement of the TVOC results compared to previous round-robin tests of the GEV in 2017 and 2020. The relative standard deviation from the weighted mean was 30 to 54 % for the TVOC value in toluene equivalents and the sum of VOCs, the TVOCSPEZ.
64 to 79 % of the participants delivered good satisfactory results with a z score between +1 and -1 for the TVOC value in toluene equivalents, and for the sum of VOCs, the TVOCSPEZ, for the three tested products.
The TVOC value in toluene equivalents is used historically and globally to assess the total emissions of products. Meanwhile, authorities and many labelling organisations in German speaking countries prefer to use the sum of VOCs for that purpose, the TVOCSPEZ. This is justified by stating that the TVOCSPEZ value is closer to the real concentrations than the TVOC value in toluene equivalents. EN 16516 allows both ways of calculation. The significance of both parameters had been discussed in depth in an earlier study [3].
The TVOC value in toluene equivalents was supposed to be independent of which specific VOCs are part of the VOC mixture in the test chamber air. This was true in the beginning of VOC testing. At that time, a flame ionisation detector (FID) was used. Later, more emphasis was placed on identification of individual VOCs. The testing laboratories then used mass selective detectors (MSD).
The testing laboratories reported that the TVOC no longer is independent of the VOCs in the mixture when analysed by an MSD. The TVOC further is impacted by the analytical device in use, and even by different operating parameters.
The impact of the both approaches is illustrated in Figure 4, 5 and 6.
 for the tested parquet adhesive. Graphic: Author")
Figure 4. Ratio for TVOCSPEZ to TVOC in toluene equivalents (TE) for the tested parquet adhesive. Graphic: Author
 for the tested parquet lacquer. Graphic: Author")
Figure 5. Ratio for TVOCSPEZ to TVOC in toluene equivalents (TE) for the tested parquet lacquer. Graphic: Author
 for the tested levelling compound. Graphic: Author")
Figure 6. Ratio for TVOCSPEZ to TVOC in toluene equivalents (TE) for the tested levelling compound. Graphic: Author
The sum of VOCs, the TVOCSPEZ, was compared with the TVOC in toluene equivalents (TE). The TVOCSPEZ was very similar to the TVOCTE in some cases. But TVOCSPEZ and TVOCTE were very different in other cases.
Despite all its limitations, a TVOC value in toluene equivalents may be a significant parameter to survey total emissions where there is a similar composition of the emitted mixture of VOCs. This may be used for development purposes or for factory control, but without any ambition of health risk control. In the case of product evaluation, a TVOC value (calculated by whatever procedure) only can be an indicator whether „more“ or „less“ is emitted in total. This is of special relevance for rating systems that do without evaluation of the individual VOCs, such as BREEAM and Green Star. The same applies to rating systems that have very short lists of target VOCs, such as the French VOC emissions label and the Californian CDPH method.
GEV uses the TVOC in toluene equivalents as well, to compare products regarding the total emissions. GEV additionally considers health related characteristics of the emissions by including the R value for products labelled as EC 1PLUS.
4.3 R value
The health impact of a potentially hazardous substance depends on its substance specific toxicity and on the exposure to this substance. Most times a mixture of VOCs is present. There is no toxicological cause-and-effect scheme available to describe interactions between the VOCs in such mixtures that is generally accepted and easy to handle. In a simplified approach, an additive effect is assumed, ignoring any possible reciprocally intensifying („synergistic“) or attenuating („antagonistic“) effects between the substances. Instead, the substance specific toxicity equivalents are evaluated separately and then summed.
LCI (Lowest Concentration of Interest) values have been specified for a large variety of volatile organic compounds (VOCs). LCI values are part of the product evaluation by several rating systems, such as the EMICODE testing method [5] and the German AgBB scheme [9]. Currently, the German list includes some 200 LCI values for individual substances. A harmonised EU list [11] includes some 160 agreed LCI values. These have been specified following a harmonised European procedure. Additive health effects are assumed for all VOCs with a concentration of at least 5 µg/m³ each. Then it is specified that the risk factor R, i.e., the sum of all Ri of the individual substances, must not exceed a limit value of 1:
Ri = Ci / LCIi with Ci = Concentration of an individual substance in air
R = Sum of all Ri = Sum of all quotients
This procedure is a cumulative assessment of an assumed hazard of the substances in a VOC mixture. It has the ambition to provide an indicative assessment factor (the R value) for the health risk potential of a tested product.
The results of the R value showed a relative standard deviation from the weighted mean of 45 to 66 %. 59 to 74 % of the participants delivered good satisfactory results with a z score between +1 and –1 for the R value for the three tested products.
4.4 Results of individual VOCs
The testing method covers a large variety of VOCs with very different chemical properties. EN 16516 [6] is the basis of the GEV testing method. It specifies a general testing method to allow determination of emissions from a large variety of construction products. This procedure is appropriate for some of these VOCs, but less applicable to other ones. The testing laboratory must adapt its own analytical procedures to the detected compounds that are visible in the chromatogram.
An additional challenge is the fact that the composition of the VOC mixture is unknown in most cases of emissions testing. Information on real ingredients would be very helpful to allow correct identification and quantification, but this usually is not available to the testing laboratory.
The results of the individual VOCs showed a relative standard deviation from the weighted mean of 39 to 89 %. 31 to 72 % of the participants produced good satisfactory results with a z score between +1 and –1 for the evaluated individual substances with significant emissions. Worst results were observed for ethylene glycol, ethyl diglycol, dipropylene glycol methylether, and especially for the n-alcohols and the iso-alcohols.
The identification and quantification of glycols, glycol ethers and glycol esters can dominate the assessment of a product where these emissions occur. The determination of certain glycols and glycol ethers is difficult but possible. This was discussed in detail in an earlier study [3]. Some laboratories had received special training on these substances. These laboratories showed better results in this round robin test.
Ethylene glycol had not been added to the tested product intentionally. It was suspected to be a trace ingredient of one of the raw materials. The reported test results may be impacted by an inhomogeneous distribution of this ingredient in the tested samples.
A special issue was the fact that the results for ethylene glycol were close to the reporting limit of 5 µg/m³ when reported in toluene equivalents. Some laboratories found more than 5 µg/m³ and reported results for ethylene glycol. 17 laboratories found ethylene glycol as well, but below 5 µg/m³ in toluene equivalents. These laboratories did not report any test result for ethylene glycol, in line with GEV testing method (Figure 7). Other laboratories reported a test result in any case.
 for the tested levelling compound. Graphic: QuoData GmbH")
Figure 7. Results for ethylene glycol (LCI# 6-2) for the tested levelling compound. Graphic: QuoData GmbH
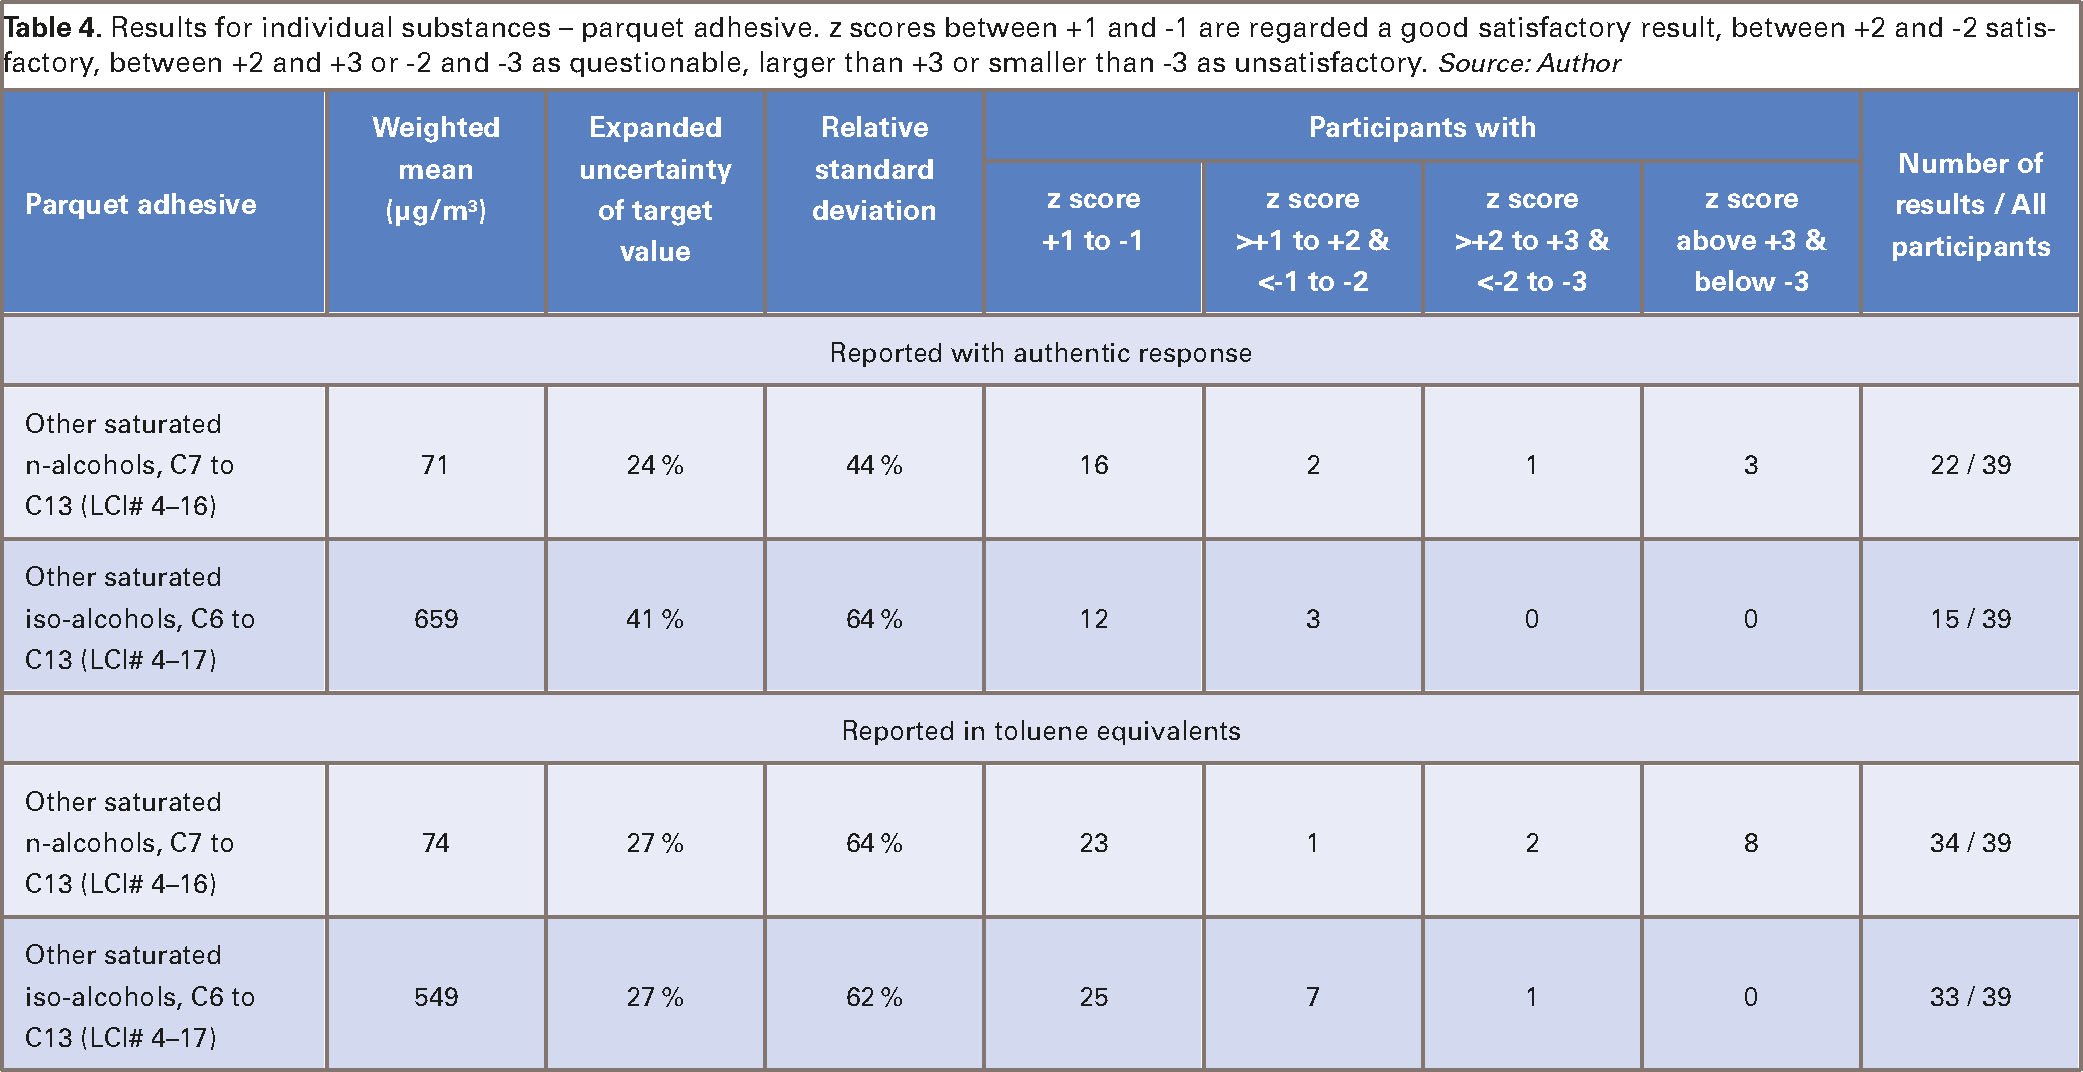
Another challenge in this round robin test was the determination of alcohols with the parquet adhesive sample. In earlier times, the AgBB LCI list had one LCI value for a group of „Other saturated n- and iso-alcohols, C4 to C10“, LCI# 4-13. The 2021 revision of the AgBB LCI list skipped this LCI. Instead, two new groups were established: „Other saturated n-alcohols, C7 to C13“ (LCI# 4–16) and „Other saturated iso-alcohols, C6 to C13“ (LCI# 4–17). The performance of the laboratories was poorer for these groups than for other measured VOCs. Several participants even did not report any test result at all, see Figure 8 for LCI# 4-16 and Figure 9 for LCI# 4-17.
 for the tested parquet adhesive. Graphic: QuoData GmbH")
Figure 8. Results for other saturated n-alcohols, C7 to C13 (LCI# 4-16) for the tested parquet adhesive. Graphic: QuoData GmbH
 for the tested parquet adhesive. Graphic: QuoData GmbH")
Figure 9. Results for other saturated iso-alcohols, C6 to C13 (LCI# 4–17) for the tested parquet adhesive. Graphic: QuoData GmbH
The testing laboratories now need to distinguish between n-alcohols and iso-alcohols. A discussion of GEV with 5 leading testing laboratories concluded that this differentiation is a severe challenge for many laboratories. Identification of VOCs requires that they have specific retention times in the gas chromatogram. But overlap occurs often between the signal peaks of n- and iso-alcohols. You still can differentiate these VOCs if the mass spectra are different. But in many cases the same mass fragments appear with n- and iso-alcohols. And the mass peaks of these groups are similar as well. This complicates the unambiguous allocation of signal peaks to either the n-alcohols or the iso-alcohols. Then the laboratories will assign different numbers of VOCs to these groups, resulting in different sum values for the n- and iso-alcohols. A good solution would be if AgBB skipped the differentiation between LCI values for groups of n- and iso-alcohols.
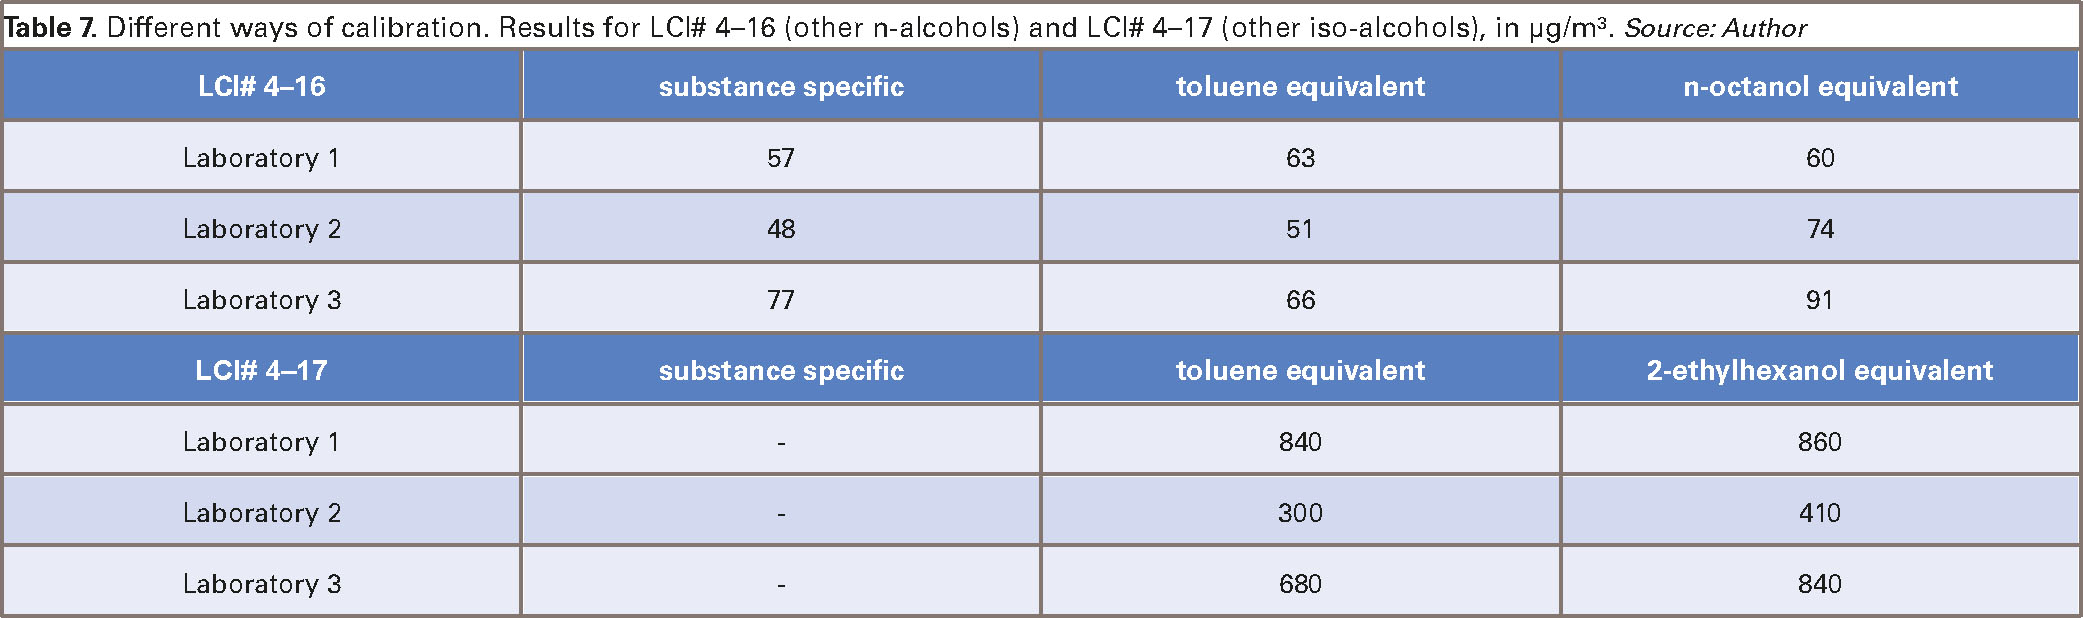
Another challenge is calibration. EN 16516 requires calibration of each target compound that has an assigned LCI value with its respective calibration standard. But these standards are available for single substances only, not for groups of alcohols. EN 16516 allows to calibrate with a substitute in that case.
This can be the most appropriate authentic response factor of a similar substance, or it can be toluene. The impact of this decision on the test result is shown in Table 7. Three experienced laboratories performed different ways of calibration.
The laboratories shall select the most appropriate calibration. These make different decisions on how to calibrate, resulting in additional uncertainty of the determination of the n- and iso-alcohols. The laboratories had not been asked to disclose how they calibrated for reporting with the authentic response. They could have tried to apply authentic response factors to as many identified alcohols as possible. Or they might have calculated the results in toluene equivalents, or in other equivalents.
A good solution would be to report all results in toluene equivalents if the LCI value is specified for a group of substances. This would avoid that different decisions on how to calibrate will result in different test results.
4.5 Round-robin tests as performance assessment of testing laboratories
Round-robin test data can be used to assess the qualification of testing laboratories. One essential criterion is the number of reported satisfactory test data (i.e., with a z score between +2 and –2, or even between +1 and –1). But this assessment should be based only on those parameters for which a statistical evaluation is meaningful. These were in this round-robin test:
- TVOC (EN 16516),
- Sum of VOCs (TVOCSPEZ, AgBB),
- R value,
- Individual substances with significant emissions, determined with substance specific calibration.
No objective true target value is available. It may occur that a larger group of laboratories delivers the wrong results systematically or at random, see chapter 2.3.5. Therefore, a statistical evaluation should always be followed by a technical assessment and a plausibility check. The uncertainty of test results is influenced not only by the performance of the participating laboratories. The tested samples were taken from technical products. These are not optimized for homogeneous VOC emissions across the product.
Another criterion is how many of the expected individual substances have been detected. An assessment of the performance of a testing laboratory can include information outside the round-robin test as well, such as the degree of experience with testing for the EMICODE, testing capacity and delivery time.
22 participating laboratories fulfilled the requirements of GEV in this round-robin test. An accreditation according to ISO/IEC 17025 [12] is very important for a positive rating of a testing laboratory, as this accreditation requires basic quality performance. But this accreditation needs to include specifically the GEV testing method or EN 16516 to be of value here. On this basis, GEV offers a list with recommended testing laboratories on its homepage, www.emicode.com. Currently 18 laboratories from 6 countries are on that list. All laboratories that already had been on that list before this round-robin test performed sufficiently well, except 2 laboratories that did not participate at all and now are deleted from that list.
5 Conclusions and outlook
The results of the GEV round-robin test 2023 with 39 participants showed a similar variation of the results of TVOC, R value and of individual substances as in previous round-robin tests of the GEV in 2017 and 2020. The uncertainty of the test results confirms that single test results alone are not significant. This is why GEV discloses VOC emissions only in terms of broad emissions classes.
The performance of 22 laboratories was rated by GEV to be good. Currently, a list of recommended testing laboratories for GEV emissions testing comprises 18 laboratories from 6 countries. These laboratories met the performance requirements of GEV in the round-robin test and presented an accreditation of this testing protocol according to ISO/IEC 17025.
Literature
- Oppl, R.: Reliability of VOC emission chamber testing – progress and remaining challenges. Gefahrstoffe – Reinhalt. Luft, 68 (2008) 3, 83-86.
- Windhövel, U.; Oppl, R.: Praktische Überprüfung des Konzepts zur gesundheitlichen Bewertung von Bauprodukten (Practical evaluation of the approach of health-related assessment of construction products, in German). Gefahrstoffe – Reinhalt. Luft 65 (2000) 4, 81-89.
- Oppl, R.; Broege, M.; Kuebart, F.; Neuhaus, T.; Wensing, M.: Reliability of VOC emission chamber testing – A round-robin test with flooring adhesives and a parquet lacquer. Gefahrstoffe – Reinhalt. Luft 80 (2020) 4, 141-150.
- Oppl, R.: Reliability of VOC emission chamber testing – A round-robin test with flooring adhesives and a parquet lacquer. Gefahrstoffe – Reinhalt. Luft 82 (2022) 01-02, 23-30.
- Association for the Control of Emissions in Products for Flooring Installation, Adhesives and Building Materials (GEV): GEV – Testing Method, Determination of Volatile Organic Compounds for Evaluation of Emissions Controlled Products for Flooring Installation, Adhesives, Construction Products, as well as Lacquers, Finishes and Oils for Parquet, for Mineral Floorings and for Resilient Floorings, 2022, available in the Internet at www.emicode.com/home/.
- EN 16516 (2017): Construction products: Assessment of release of dangerous substances – Determination of emissions into indoor air.
- ISO 13528 (2022): Statistical methods for use in proficiency testing by interlaboratory comparison.
- ISO/IEC 17043 (2010): Conformity assessment — General requirements for proficiency testing.
- AgBB-Scheme: Committee for Health-related Evaluation of Building Products AgBB: Health-related Evaluation Procedure for Emissions of Volatile Organic Compounds (VVOC, VOC and SVOC) from Building Products, 2018 and 2021, published in the Internet at https://www.umweltbundesamt.de/en/topics/health/commissions-working-groups/committee-for-health-related-evaluation-of-building#textpart-1
- VDI 4301 Blatt 7 (2018): Measurement of indoor air pollution – Measurement of carboxylic acids.
- EU LCI list: https://ec.europa.eu/growth/sectors/construction/eu-lci_en
- ISO/IEC 17025 (2017): General requirements for the competence of testing and calibration laboratories.

Reinhard Oppl,
VOC-Consult, Wedel.Foto: Autor